
Machine Learning with Python
Author: Andreas Traut Date: 08.05.2020 (Updates 24.07.2020) See also my Book "From Zero to Senior Data Science" for major updates. Download as PDF
[TOC]
Machine Learning with Python
0. Introduction
a) Aim of this repository: "Small Data" versus "Big Data"
After having learnt visualization techniques in Python (which I showed in my repository "Visualization-of-Data-with-Python"), I started working on different datasets with the aim to learn and apply machine learning algorithms. I was particularly interested in better understanding the differences and similarities of "Small Data" (Scikit-Learn) approaches versus the "Big Data" (Spark) approaches!
Therefore I tried to focus more on this "comparison" question of "Small Data" coding vs "Big Data" coding instead of digging into too many details of each of these approaches. I haven't seen many comparisons of "Small Data" vs "Big Data" coding and I think understanding this is interesting and important.
b) Motivation for IDEs
I will use Jupyter-Notebooks, which is a widespread standard today, but I will also use Integrated Development Environments (IDEs). The first Jupyter-Notebooks have been developed 5 years ago (in 2015). Since my first programming experience was more than 25 years ago (I started with GW-Basic then Turbo-Pascal and so on and I am also familiar with MS-DOS). I quickly learnt the advantages of using Jupyter-Notebooks. But I missed the comfort of an IDE from the very first days!
Why is it important for me to mention the IDEs out so early in a learning process? In my opinion Jupyter-Notebooks are good for the first examinations of data and for documenting procedures and up to a certain degree also for sophisticated data science. But it might be a good idea to learn very early how to work with an IDE. Think about how to use what has been developed so far later in a bigger environment (for example a Lambda-Architecture, but you can take whatever other environment, which requires robustness&stability). I point this out here, because after having read several e-Books and having participated in seminars I see that IDEs are not in the focus.
Therefore: in my examples in this repository here I will also work with Python ".py" files. These ".py" can be executed in an IDE, like e.g. Spyder-IDE, which can be downloaded for free and looks like this:

c) Structure of this repository
(i) First part: "Movies Database" example
Therefore the first example uses a Jupyter-Notebook in order to learn the standard procedures (e.g. data-cleaning & preparing, model-training,...). I worked on data converning movies and their revenues.
(ii) Second part: Scikit-Learn Example ("Small Data")
The second example is for being used in an IDE (integrated developer environment), like the Spyder-IDE from the Anaconda distribution and apply the "Scikit-Learn Python Machine Learning Library" (you may call this example a "Small Data" example if you want). I will show you a typical structure for a machine-learning example and put it into a mind-map. The same structure will be applied on the third example.
(iii) Third part: Spark Example ("Big Data")
The third example is a "Big Data" example and will use a Docker environment and apply the "Apache Machine Learning Library", a scalable machine learning library. The mind-map from the second part will be extended and aligned to the second example.
In this example I also show some Big Data Visualizations techniques, show how the K-Means Clustering Algorithm in Apache Spark ML works and explain the Map-Reduce programming model on a Word-Count example.
(iv) Summary Mind-Map
I provide a summary mind-map, which possibly helps you to structure your code. There are lots of similarities between "Small Data" and "Big Data".
(v) Digression (Excurs) to Big Data Visualization and K-Means Clustering Algorithm and Map-Reduce
In this Digression (Excurs) I will provide some examples for Big Data Visualization, K-Means Clustering and Map-Reduce.
d) Future learnings and coding & data sources
For all of these topics various tutorials, documentation, coding examples and guidelines can be found in the internet for free! The Open Source Community is an incredible treasure trove and enrichment that positively drives many digital developments: Scikit-Learn, Apache Spark, Spyder, GitHub, Tensorflow and also Firefox, Signal, Threema, Corona-Warnapp... to be mentionned. There are many positive examples of sharing code and data "for free".
Coding:
If you Google for example "how to prepare and clean the data with spark", you will find tons of documents around "removing null values" or "encoders" (like the OneHotEncoder for treating categorical inputs) or "pipelines" (for putting all the steps in an efficient, customizable order) so on. You will be overwhelmed of all this. Some resources to mention are the official documentation and a few more Github repositories like e.g. tirthajyoti/Spark-with-Python (MIT licence), Apress/learn-pyspark (Freeware License), mahmoudparsian/pyspark-tutorial (Apache License v2.0). What I will do here in my repository is nothing more than putting it together so that it works for my problem (which can be challenging as well sometimes). Adapting it for your needs should be easier from this point on.
Data:
If you would like to do further analysis or produce alternate visualizations of the Airbnb-data, you can download them from here. It is available below under a Creative Commons 1.0 Universal "Public Domain Dedication" license. The data for the Vermont-Vendor-Payments can be downloaded from here and are available under the Open Data Commons Open Database License. The movies database doesn't even mention a license and is from Kaggle. There you find a lot of more datasets and also coding examples for your studies.
I. "Movies Database" Example
A good starting point for finding useful datasets is "Kaggle" (www.kaggle.com). I downloaded the movies dataset from here. The dataset from Kaggle contains the following columns:
Rank | Title | Year | Score | Metascore | Genre | Vote | Director | Runtime | Revenue | Description | RevCat
In this example I want to predict the "Revenue" based on the other information, which I have for each movie (e.g. every movie has a year, a scoring, a title ...). There are some "NaN"-values in the column "Revenue" and instead of filling them with an assumption (e.g. median-value) as I did in another Jupiter-Notebook (see here), I wanted to predict these values. You might guess the conclusion already: predicting the revenue based on the available information as shown above (the columns) might not work. But essential to me is more to follow a well established standard-process of data-cleaning, data-preparing, model-training and error-calculation in this example in order to learn how to apply this process to better datasets, than the movies-dataset, later.
Therefore, here is how I approached the problem step-by-step:
1. Separate "NaN"-values
I separated the rows with "NaN"-values in column "Revenue"

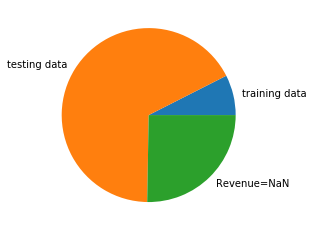
2. Draw a stratified sample
I drew a stratified sample (based on "Revenue") on this remaining dataset and I received a training dataset and testing dataset:

3. Create a pipeline
I created a pipeline to fill the "NaN"-value in other columns (e.g. "Metascore", "Score").


4. Fit the model
I used the training dataset and fittet it with the "DecisionTreeRegressor" model

5. Cross-validation
I verified with a cross-validation, how good this model/parameters are

6. Prediction
I did a prediction on a subset of the testing dataset and did a side-by-side comparison of prediction and true value

I performed a prediction on the testing dataset and calculated the mean-squared error

7. Conclusion
The conclusion of this machine learning example is obvious: it is rather not possible to predict the "Revenue" based on the available information (the most useful numerical features were "year", "score", ... and the other categorical like "genre" don't seem to have much more added value in my opinion).
Please find the complete Jupyter Notebook here:
If you want to run the code immediately without installing the required "Jupyter environment" then you can use this Deepnote-Link:
https://beta.deepnote.com/project/754094f0-3c01-4c29-b2f3-e07f507da460
II. "Small Data" Machine Learning using "Scikit-Learn"
In my opinion Jupyter Notebooks are not always the best environment for learning to code! I agree, that Jupyter Notebooks are nice for doing documentation of python code. It really looks beautiful. But I prefer debugging in an IDE instead of a Jupyter Notebook: having the possibility to set a breakpoint can be a pleasure for my nerves, specially if you have longer programms. Some of my longer Jupyter Notebooks feel from the hundrets line of code onwards more like pain than like anything helpful. And I also prefer having a "help window" or a "variable explorer", which is smoothly integrated into the IDE user interface. And there are a lot more advantages why getting familiar with an IDE is a big advantage compared to the very popular Jupyter Notebooks! I am very surprised, that everyone is talking about Jupyter Notebooks but IDEs are only mentionned very seldomly. But maybe my preferences are also a bit different, because I grew up in a MS-DOS environment. :-)
I choose in this second example the Spyder-IDE and worked on "Scikit-Learn", a very popular python machine learning library. The basis of this code are some Jupyter-Notebooks, which Aurelien Geron provided (under the Apache License 2.0) in his book "Machine Learning with Scikit-Learn & Tensorflow". But as I didn't like at all that his code are Jupyter Notebooks (how can you re-use it efficiently for your own purposes?), so I wanted to work on it: I extracted the most essential parts of chapter 2, then sorted, arranged and modified the code fragments and created the following structured Python code. The structure of the Python code is a bit similar to the steps, which I followed in the Movies Database exampole above (you will find these sections also in the ".py" file).
So let's start with the "scikit-learn" ("SmallData", if you want). I will align this structure to the Spark "Big Data" mind map below in order to learn from each of this two approaches.

1. create index
1.1 Alternative 1: generate id with static data

1.2 Alternative 2: generate stratified sampling

1.3 verify if stratified example is good
2. Discover and visualize the data to gain insights

3. prepare for Machine Learning
3.1 find all NULL-values
3.2 remove all NULL-values

4. Use "Imputer" to clean NaNs

5. treat "categorial" inputs
6. custom transformer and pipelines
6.1 custom transformer

6.2 pipelines

7. select and train model
7.1 LinearRegression model

7.2 DecisionTreeRegressor model

8. crossvalidation
8.1 for DecisionTreeRegressor

8.2 for LinearRegression

8.3 for RandomForestRegressor

8.4 for ExtraTreesRegressor

9. Save Model

10. Optimize Model
10.1 GridSearchCV
10.1.1 GridSearchCV on RandomForestRegressor

10.1.2 GridSearchCV on LinearRegressor

10.2 Randomized Search

10.3 Analyze best models

11. Evaluate final model on test dataset

III. "Big Data" Machine Learning using the "Spark ML Library"
This will be an example for a "Big-Data" environment and uses the "Apache MLib" scalable machine learning library. Various tutorials, documentation, "code-fragments" and guidelines can be found in the internet for free (at least for your private use). The best is in my opinion the official documentation. A few more helpful sources are the following Github repositories:
tirthajyoti/Spark-with-Python (MIT licence)
Apress/learn-pyspark (Freeware License)
mahmoudparsian/pyspark-tutorial (Apache License v2.0)
Concerning the topic "Big Data" I want to add the following: I passed a certification as "Data Scientist Specialized in Big Data Analytics". I must say: Understanding the concept of "Big-Data" and how to differenciate "standard" machine learning from a "scalable" environment is not easy. I recommend a separate training! Some steps are a bit similar to "scikit-learn" (e.g. data-cleaning, preprocessing), but the technical environment for running the code is different and also the code itself is different.
I added a "Digression (Excurs)" at the end of this document which covers the topics "Big Data Visualization", "K-Means-Clustering in Spark" and "Map-Reduce" (one of the powerful programming models for Big Data).
Let's start with the structure, which I put into a mind map (you can download it from this repository). I aligned the structure to the SkLearn mind map above in order to learn from each of this two approaches.

There are different ways to approach the Apache Spark and Hadoop environment: you can install it on your own computer (which I found rather difficult because of lack of userfriendly and easy understandable documentation). Or you can dive into a Cloud environment, like e.g. Microsoft Azure or Amazon EWS or Google Cloud and try to get a virtual machine up and running for your purposes. Have a look at my documentation, where I shared my experiences, which I had with Microsoft Azure here.
For the following explanation I decided to use Docker. What is Docker? Docker is "an open-source project that automates the deployment of software applications inside containers by providing an additional layer of abstraction and automation of OS-level virtualization on Linux." Learn from the Docker-Curriculum how it works. I found an container, which had Apache Spark Version 3.0.0 and Hadoop 3.2 installed and built my machine-learning code (using pyspark) on top of this container.
I shared my code and developments on Docker-Hub in the following repository here. After having installed the Docker application you will need to pull my "machine-learning-pyspark" image to your computer:
docker pull andreastraut/machine-learning-pyspark
Then open Windows Powershell and type the following:
docker run -dp 8888:8888 andreastraut/machine-learning-pyspark:latest

You will see in your Docker Dashborad that a container is running:

After having opened your browser (e.g. Firefox-Browser), navigate to "localhost:8888" (8888 is the port, which will be opened).

The folder "data" contains the datasets. If you would like to do further analysis or produce alternate visualisations of the Airbnb-data, you can download them from here. It is available below under a Creative Commons CC0 1.0 Universal (CC0 1.0) "Public Domain Dedication" license. The data for the Vermont-Vendor-Payments can be downloaded from here and are available under the Open Data Commons Open Database License.

When you open the Jupyter-Notebook, you will see, that Apache Spark Version 3.0.0 and Hadoop Version 3.2 is installed:

0. Initialize Spark
Initializing a Spark sessions works and reading a CSV file can by done with the following commands (see more documentation here and also have a look at a "Get Started Guide"):

0.1 Create Spark Context and Spark Session

0.2 Read CSV

0.3 Dataset Properties and some Select, Group and Aggregate Methods
After then the data-cleaning and data preparation (eliminating of null values, visualization techniques) work pretty similar to the "Small data" (Sklearn) approach.
0.4 Write as Parquet or CSV
If you want to persist (=save) your intermediate you can do it as follows:

0.5 Read Parquet
See jupyter notebook.
0.6 How to stop a Spark Session and Spark Context
See jupyter notebook.
1. Cleaning the data
1.1 Show number of rows and columns and do some visualizations
1.2 Replacing and Casting
1.3 Null-Values
1.4 String Values
2. Model-specific preprocessing
2.0 Check missing entries and define userdefined scatter plot
2.1 StringIndexer
I included some examples of how features can be extracted, transformed and selected in the Jupyter-Notebook (see more documentation here). Just to mention a few here: the "StringIndexer", "OneHotEncoder" and "VectorAssembler" work as follows:

2.2 OntHotEncoder

2.3 VectorAssembler

2.4 CountVectorizer
3. Aligning and numerating Features and Labels
3.1 Aligning
3.2 Numerating
4. Pipelines
5. Training data and Testing data
6. Apply models and evaluate
6.1 Ordinary Least Square Regression
After having extracted, transformed and selected features you will want to apply some models, which are documented here, for example the "OLS Regression":

6.2 Ridge Regression
6.3 Lasso Regression
6.4 Decision Tree
7. Minhash und Local-Sensitive-Hashing (LSH)
see example: https://github.com/AndreasTraut/Deep_learning_explorations
8. Alternative-Least-Square (ALS)
8.1. Datapreparation for ALS
8.2 Build the recommendation model using alternating least squares (ALS)
8.3 Get recommendations
8.4 Clustering of Users with K-Means
see example: https://hub.docker.com/repository/docker/andreastraut/machine-learning-pyspark
8.5 Perform a PCA and draw the 2-dim projection
IV. Summary Mind-Map
To summarize the whole coding structure have a look at the following and also the provided mind-maps. My mind map below may help you to structure your code:

V. Digression (Excurs) to Big Data Visualization and K-Means Clustering Algorithm and Map-Reduce
Digression (Excurs) to Big Data Visualization and K-Means Clustering Algorithm and Map-Reduce
(i) Big Data Visualization: You will see a Jupyter-Notebook (which contains the Machine-Learning Code) and a folder named "data" (which contains the raw-data and preprocessed data). As you can see: I also worked on a 298 MB big csv-file ("Vermont_Vendor_Payments.csv"), which I coulnd't open in Excel, because of the huge size. This file contains a list of all state of Vermont payments to vendors (Open Data Commons Licence) and has more than 1.6 million lines (exactly 1'648'466 lines). I already mentionned in my repository "Visualization-of-Data-with-Python", that the visualization of big datasets can be difficult when using "standard" office tools, like Excel. If you are not able to open such csv-files in Excel you have to find other solutions. One is to use PySpark which I will show you here. Another solution would have been to use the Excel built-in connection, PowerQuery or something similar, maybe Access or whatever, which is not the topic here, because we also want to be able to apply machine-learning algorithms from the Spark Machine Learning Library. And there are more benefits of using PySpark instead of Excel: it can handle distributed processing, it's a lot faster, you can use pipelines, it can read many file systems (not only csv), it can process real-time data.
(ii) K-Means Clustering Algorithm: Additionally I worked on this dataset to show how the K-Means Clustering Algorithm can be applied by using the Spark Marchine-Learning Libary (see more documentation here). I will show how the "Vermont Vendor Payments" dataset can be clustered. In the images below every color represents a differents cluster:


(iii) Map-Reduce: This is a programming model for generating big data sets with parallel distributed algorithm on a cluster. Map-Reduce is very important for Big Data and therefore I added some Jupyter-Notebooks to better understand how it works. Learn the basis of the Map-Reduce programming model from here and then have a look into my jupyter notebook for details. I used the very popular "Word Count" example in order to explain Map-Reduce in detail. In another application of Map-Reduce I found the very popular term frequency–inverse document frequency (short TF-idf) very interesting (see Wikipedia). This is a numerical statistic, which is often used in text-based recommender systems and for information retrieval. In my example I used the texts of "Moby Dick" and "Tom Sawyer". The result are two lists of most important words for each of these documents. This is what the TF-idf found: Moby Dick: WHALE, AHAB, WHALES, SPERM, STUBB, QUEEQUEG, STRARBUCK, AYE Tom Sawyer: HUCK, TOMS, BECKY, SID, INJUN, POLLY, POTTER, THATCHER Applications for using TF-idf are in the information retrieval or to classify documents. Have a look into my notebook here to learn more about Big Data Visualization, K-Means Clustering Algorithm, Map-Reduce and TF-idf.
Apache License Version 2.0
TERMS AND CONDITIONS FOR USE, REPRODUCTION, AND DISTRIBUTION
Definitions.
"License" shall mean the terms and conditions for use, reproduction, and distribution as defined by Sections 1 through 9 of this document.
"Licensor" shall mean the copyright owner or entity authorized by the copyright owner that is granting the License.
"Legal Entity" shall mean the union of the acting entity and all other entities that control, are controlled by, or are under common control with that entity. For the purposes of this definition, "control" means (i) the power, direct or indirect, to cause the direction or management of such entity, whether by contract or otherwise, or (ii) ownership of fifty percent (50%) or more of the outstanding shares, or (iii) beneficial ownership of such entity.
"You" (or "Your") shall mean an individual or Legal Entity exercising permissions granted by this License.
"Source" form shall mean the preferred form for making modifications, including but not limited to software source code, documentation source, and configuration files.
"Object" form shall mean any form resulting from mechanical transformation or translation of a Source form, including but not limited to compiled object code, generated documentation, and conversions to other media types.
"Work" shall mean the work of authorship, whether in Source or Object form, made available under the License, as indicated by a copyright notice that is included in or attached to the work (an example is provided in the Appendix below).
"Derivative Works" shall mean any work, whether in Source or Object form, that is based on (or derived from) the Work and for which the editorial revisions, annotations, elaborations, or other modifications represent, as a whole, an original work of authorship. For the purposes of this License, Derivative Works shall not include works that remain separable from, or merely link (or bind by name) to the interfaces of, the Work and Derivative Works thereof.
"Contribution" shall mean any work of authorship, including the original version of the Work and any modifications or additions to that Work or Derivative Works thereof, that is intentionally submitted to Licensor for inclusion in the Work by the copyright owner or by an individual or Legal Entity authorized to submit on behalf of the copyright owner. For the purposes of this definition, "submitted" means any form of electronic, verbal, or written communication sent to the Licensor or its representatives, including but not limited to communication on electronic mailing lists, source code control systems, and issue tracking systems that are managed by, or on behalf of, the Licensor for the purpose of discussing and improving the Work, but excluding communication that is conspicuously marked or otherwise designated in writing by the copyright owner as "Not a Contribution."
"Contributor" shall mean Licensor and any individual or Legal Entity on behalf of whom a Contribution has been received by Licensor and subsequently incorporated within the Work.
Grant of Copyright License. Subject to the terms and conditions of this License, each Contributor hereby grants to You a perpetual, worldwide, non-exclusive, no-charge, royalty-free, irrevocable copyright license to reproduce, prepare Derivative Works of, publicly display, publicly perform, sublicense, and distribute the Work and such Derivative Works in Source or Object form.
Grant of Patent License. Subject to the terms and conditions of this License, each Contributor hereby grants to You a perpetual, worldwide, non-exclusive, no-charge, royalty-free, irrevocable (except as stated in this section) patent license to make, have made, use, offer to sell, sell, import, and otherwise transfer the Work, where such license applies only to those patent claims licensable by such Contributor that are necessarily infringed by their Contribution(s) alone or by combination of their Contribution(s) with the Work to which such Contribution(s) was submitted. If You institute patent litigation against any entity (including a cross-claim or counterclaim in a lawsuit) alleging that the Work or a Contribution incorporated within the Work constitutes direct or contributory patent infringement, then any patent licenses granted to You under this License for that Work shall terminate as of the date such litigation is filed.
Redistribution. You may reproduce and distribute copies of the Work or Derivative Works thereof in any medium, with or without modifications, and in Source or Object form, provided that You meet the following conditions:
(a) You must give any other recipients of the Work or Derivative Works a copy of this License; and
(b) You must cause any modified files to carry prominent notices stating that You changed the files; and
(c) You must retain, in the Source form of any Derivative Works that You distribute, all copyright, patent, trademark, and attribution notices from the Source form of the Work, excluding those notices that do not pertain to any part of the Derivative Works; and
(d) If the Work includes a "NOTICE" text file as part of its distribution, then any Derivative Works that You distribute must include a readable copy of the attribution notices contained within such NOTICE file, excluding those notices that do not pertain to any part of the Derivative Works, in at least one of the following places: within a NOTICE text file distributed as part of the Derivative Works; within the Source form or documentation, if provided along with the Derivative Works; or, within a display generated by the Derivative Works, if and wherever such third-party notices normally appear. The contents of the NOTICE file are for informational purposes only and do not modify the License. You may add Your own attribution notices within Derivative Works that You distribute, alongside or as an addendum to the NOTICE text from the Work, provided that such additional attribution notices cannot be construed as modifying the License.
You may add Your own copyright statement to Your modifications and may provide additional or different license terms and conditions for use, reproduction, or distribution of Your modifications, or for any such Derivative Works as a whole, provided Your use, reproduction, and distribution of the Work otherwise complies with the conditions stated in this License.
Submission of Contributions. Unless You explicitly state otherwise, any Contribution intentionally submitted for inclusion in the Work by You to the Licensor shall be under the terms and conditions of this License, without any additional terms or conditions. Notwithstanding the above, nothing herein shall supersede or modify the terms of any separate license agreement you may have executed with Licensor regarding such Contributions.
Trademarks. This License does not grant permission to use the trade names, trademarks, service marks, or product names of the Licensor, except as required for reasonable and customary use in describing the origin of the Work and reproducing the content of the NOTICE file.
Disclaimer of Warranty. Unless required by applicable law or agreed to in writing, Licensor provides the Work (and each Contributor provides its Contributions) on an "AS IS" BASIS, WITHOUT WARRANTIES OR CONDITIONS OF ANY KIND, either express or implied, including, without limitation, any warranties or conditions of TITLE, NON-INFRINGEMENT, MERCHANTABILITY, or FITNESS FOR A PARTICULAR PURPOSE. You are solely responsible for determining the appropriateness of using or redistributing the Work and assume any risks associated with Your exercise of permissions under this License.
Limitation of Liability. In no event and under no legal theory, whether in tort (including negligence), contract, or otherwise, unless required by applicable law (such as deliberate and grossly negligent acts) or agreed to in writing, shall any Contributor be liable to You for damages, including any direct, indirect, special, incidental, or consequential damages of any character arising as a result of this License or out of the use or inability to use the Work (including but not limited to damages for loss of goodwill, work stoppage, computer failure or malfunction, or any and all other commercial damages or losses), even if such Contributor has been advised of the possibility of such damages.
Accepting Warranty or Additional Liability. While redistributing the Work or Derivative Works thereof, You may choose to offer, and charge a fee for, acceptance of support, warranty, indemnity, or other liability obligations and/or rights consistent with this License. However, in accepting such obligations, You may act only on Your own behalf and on Your sole responsibility, not on behalf of any other Contributor, and only if You agree to indemnify, defend, and hold each Contributor harmless for any liability incurred by, or claims asserted against, such Contributor by reason of your accepting any such warranty or additional liability.
END OF TERMS AND CONDITIONS
Last updated